Each week on average, children in Pennsylvania consume an average of 22.862 sugary snacks, which is a higher rate than any other state in the United States. It’s such a high rate, in fact, that the next highest weekly average is much less, at 17.8 sugary snacks a week on average. This new infographic from Main Street Children’s Dentistry & Orthodontics dives into where in the United States that children consume the most sugary snacks.
Not only does this fascinating infographic include information on the overall average weekly rankings, but there are also rankings for other categories, including what states that children are consuming the most and least sugary beverages on a weekly basis. In the United States, children eat an average of 81 grams of sugar each day, which on an annual basis equates to more than 65 pounds of added sugar. When it comes to beverages, children in the United States take in more than 30 gallons of added sugars from sweet drinks alone.
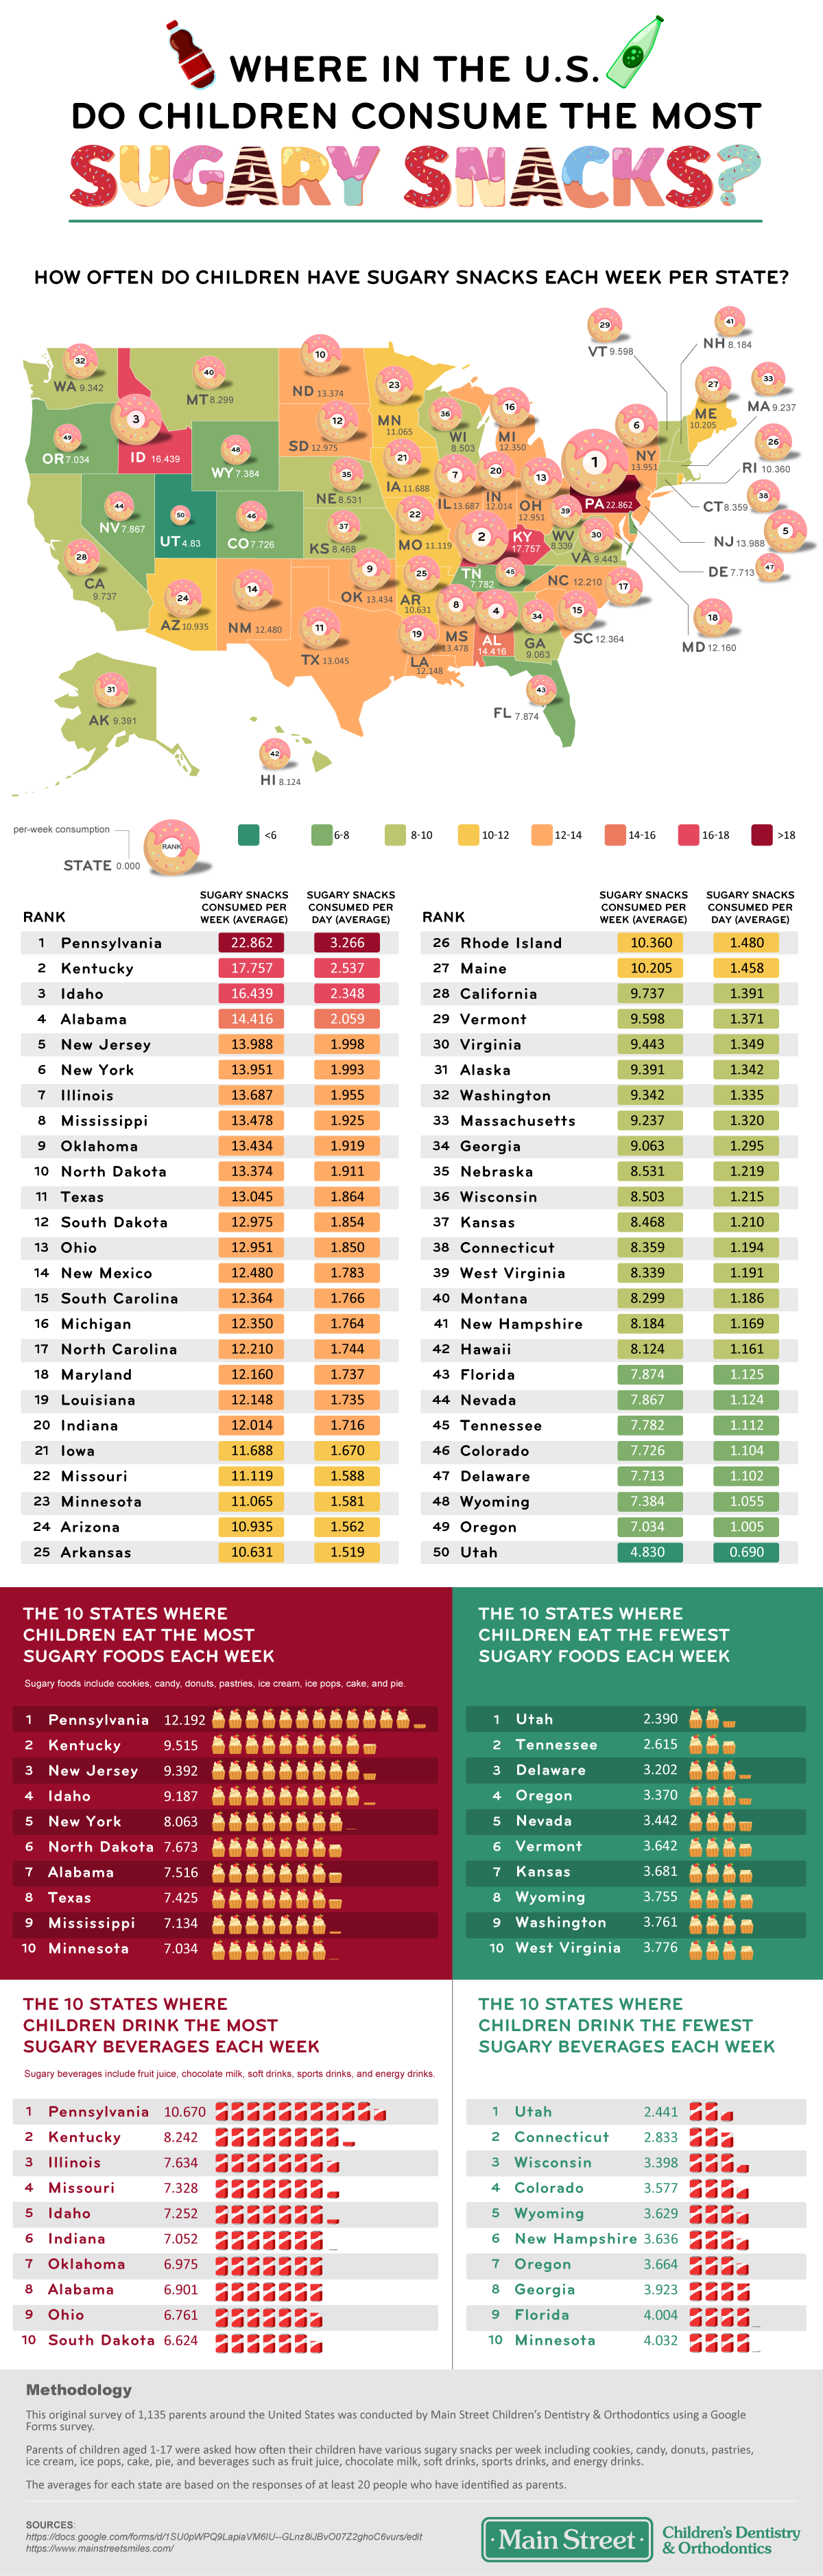
Per the research that was conducted by Main Street Children’s Dentistry & Orthodontics, it was found that these were the ten U.S. states where kids eat the most sugar based on the average number of sugary snacks that they consume each week, per their children’s sugar consumption survey.
- Pennsylvania – 22.862 sugary snacks
- Kentucky – 17.757 sugary snacks
- Idaho – 16.439 sugary snacks
- Alabama – 14.416 sugary snacks
- New Jersey – 13.988 sugary snacks
- New York – 13.951 sugary snacks
- Illinois – 13.687 sugary snacks
- Mississippi – 13.478 sugary snacks
- Oklahoma – 13.434 sugary snacks
- North Dakota – 13.374 sugary snacks
As for sugary drinks, it was found that these were the ten states where children consume the most of them on average on a weekly basis.
- Pennsylvania – 10.670 sugary beverages
- Kentucky – 8.242 sugary beverages
- Illinois – 7.634 sugary beverages
- Missouri – 7.328 sugary beverages
- Idaho – 7.252 sugary beverages
- Indiana – 7.052 sugary beverages
- Oklahoma – 6.975 sugary beverages
- Alabama – 6.901 sugary beverages
- Ohio – 6.761 sugary beverages
- South Dakota – 6.624 sugary beverages
Leave a Reply