Across the globe, wildlife populations are declining. Deforestation, poaching, and other human factors are ravaging animal habitats and pushing some species to the brink of extinction. Although we’ve taken many strides over the years such as the formation of the U.S. Fish and Wildlife Service and the passing of the Endangered Species Act of 1973, we still have a long way to go. Below you’ll find three eye-opening infographics that show the true impact of human interference on wildlife.
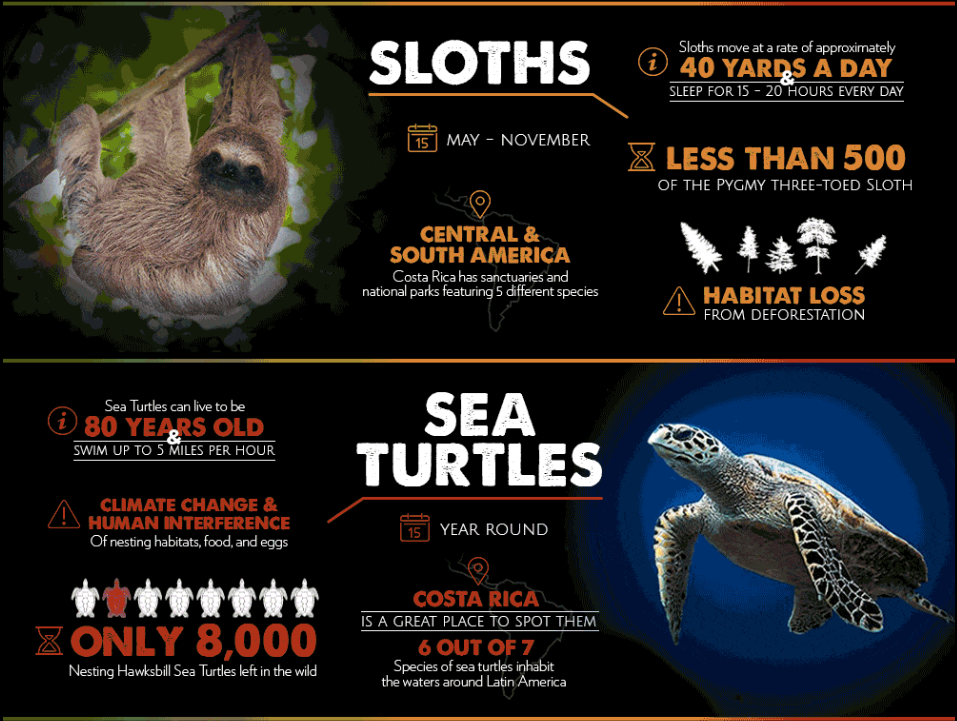
The Endangered Species in Latin America
Latin America is famous for its exotic climates and diverse wildlife. Sadly, factors like climate change and logging have left many of these animals endangered. This infographic profiles seven of the most endangered species in Latin America and roughly how many are left in their natural habitat. Special shout out to Cox & Kings for creating this stunning animated GIF infographic!
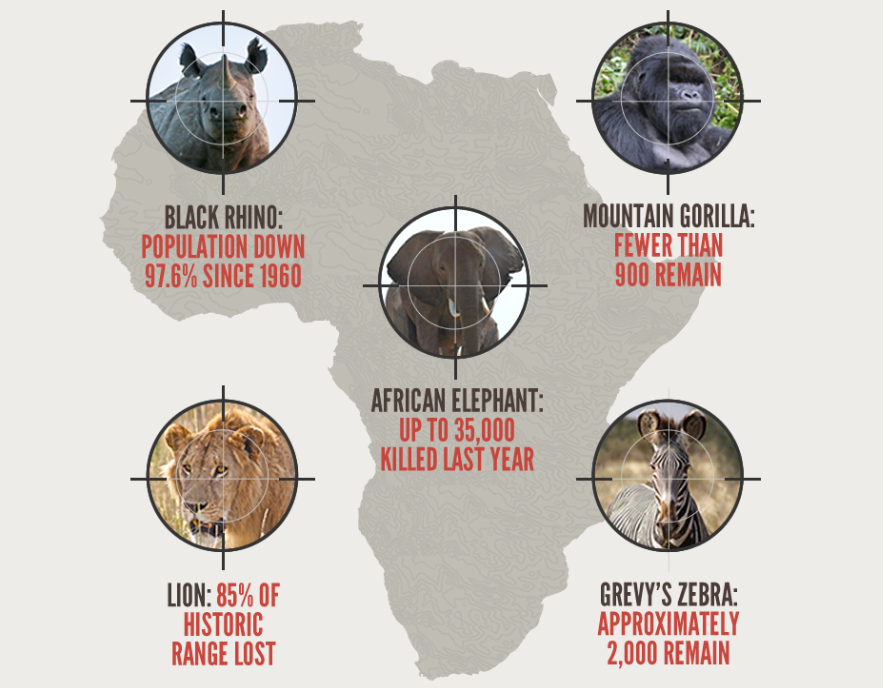
Africa’s Poaching Crisis
The African Wildlife Foundation created this infographic showing the effect of poaching in Africa. What were once some of the most abundant animals in Africa have since been hunted to a record low. This sheds some much-needed light on poaching and the crime syndicates that are often behind it.
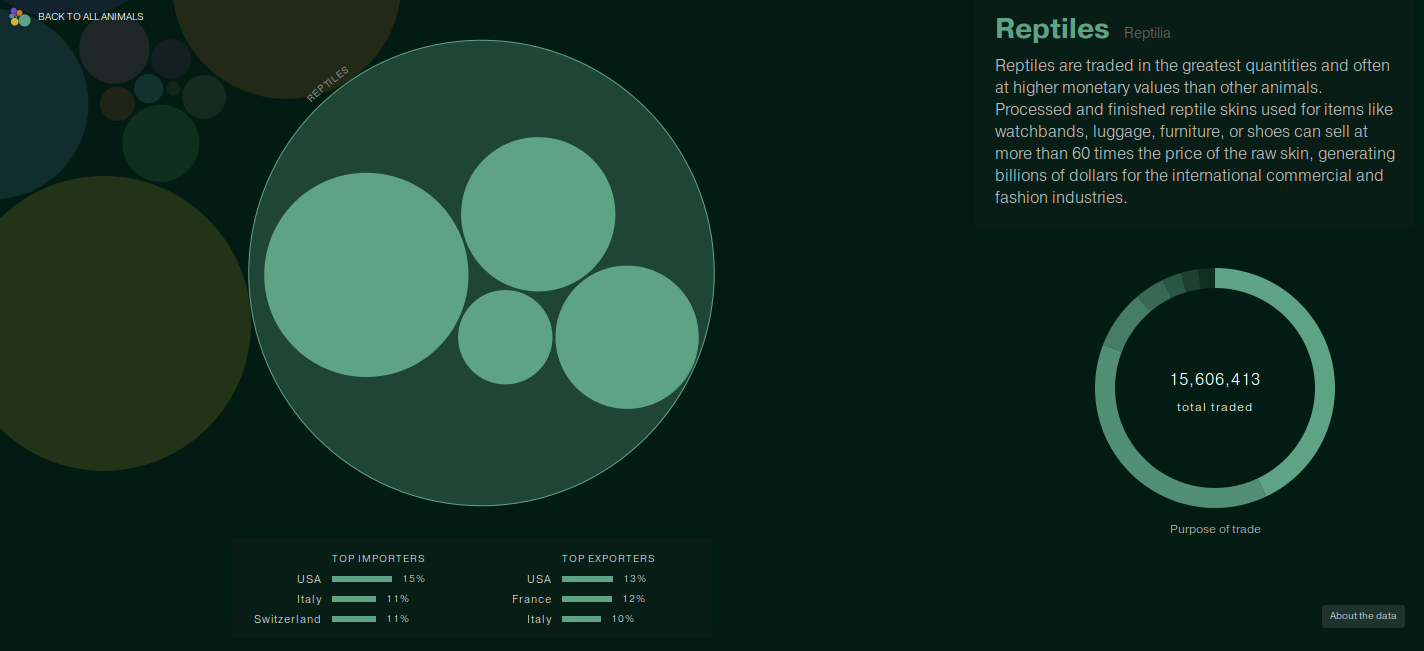
Space Monkeys & Tiger Wine: A Look at Global Animal Trade
We saved the best for last. This interactive visualization from National Geographic shows which animals are traded the most often and why. To take an example straight from the title, tigers are most often traded for medicinal purposes. In China, tiger bones are ground and made into “tiger wine” which is believed to have a number of benefits.
How many are left in the wild?
- The Bulmer’s Fruit Bat: 150
- The great Indian bustard: 50-249
- The Asiatic cheetah: less than 70
- The white bellied heron: 70-400
- The Fatu Hiva monarch: 50
- The Yangtze giant softshell turtle: only 3
Do you have a suggestion for another infographic for this series? Drop it in a comment below.
Leave a Reply