We don’t often cover real estate infographics but I wanted to make a special exception today since this one made my jaw drop. Having just purchased a house a few years ago, I can’t help but feel how lucky I am after seeing how high mortgage rates are jumping and how high house prices are skyrocketing. Let me just throw some statistics from this infographic at you to set the tone: a $500K house is 27.46% smaller today than it was in 2018 in Hawaii, 27.35% smaller in Connecticut, 25.83% in North Dakota, 23.53% smaller in Louisiana, and 22.42% smaller in Maryland. Those numbers are shocking but how would you feel if I told you that those are the 5 least affected states! Number 1 is Montana with a drop of 50.15%. That means you can only buy half the house you could in 2018, only 5 years ago. Take a deeper dive into this eye-opening infographic from BuilderPad below:
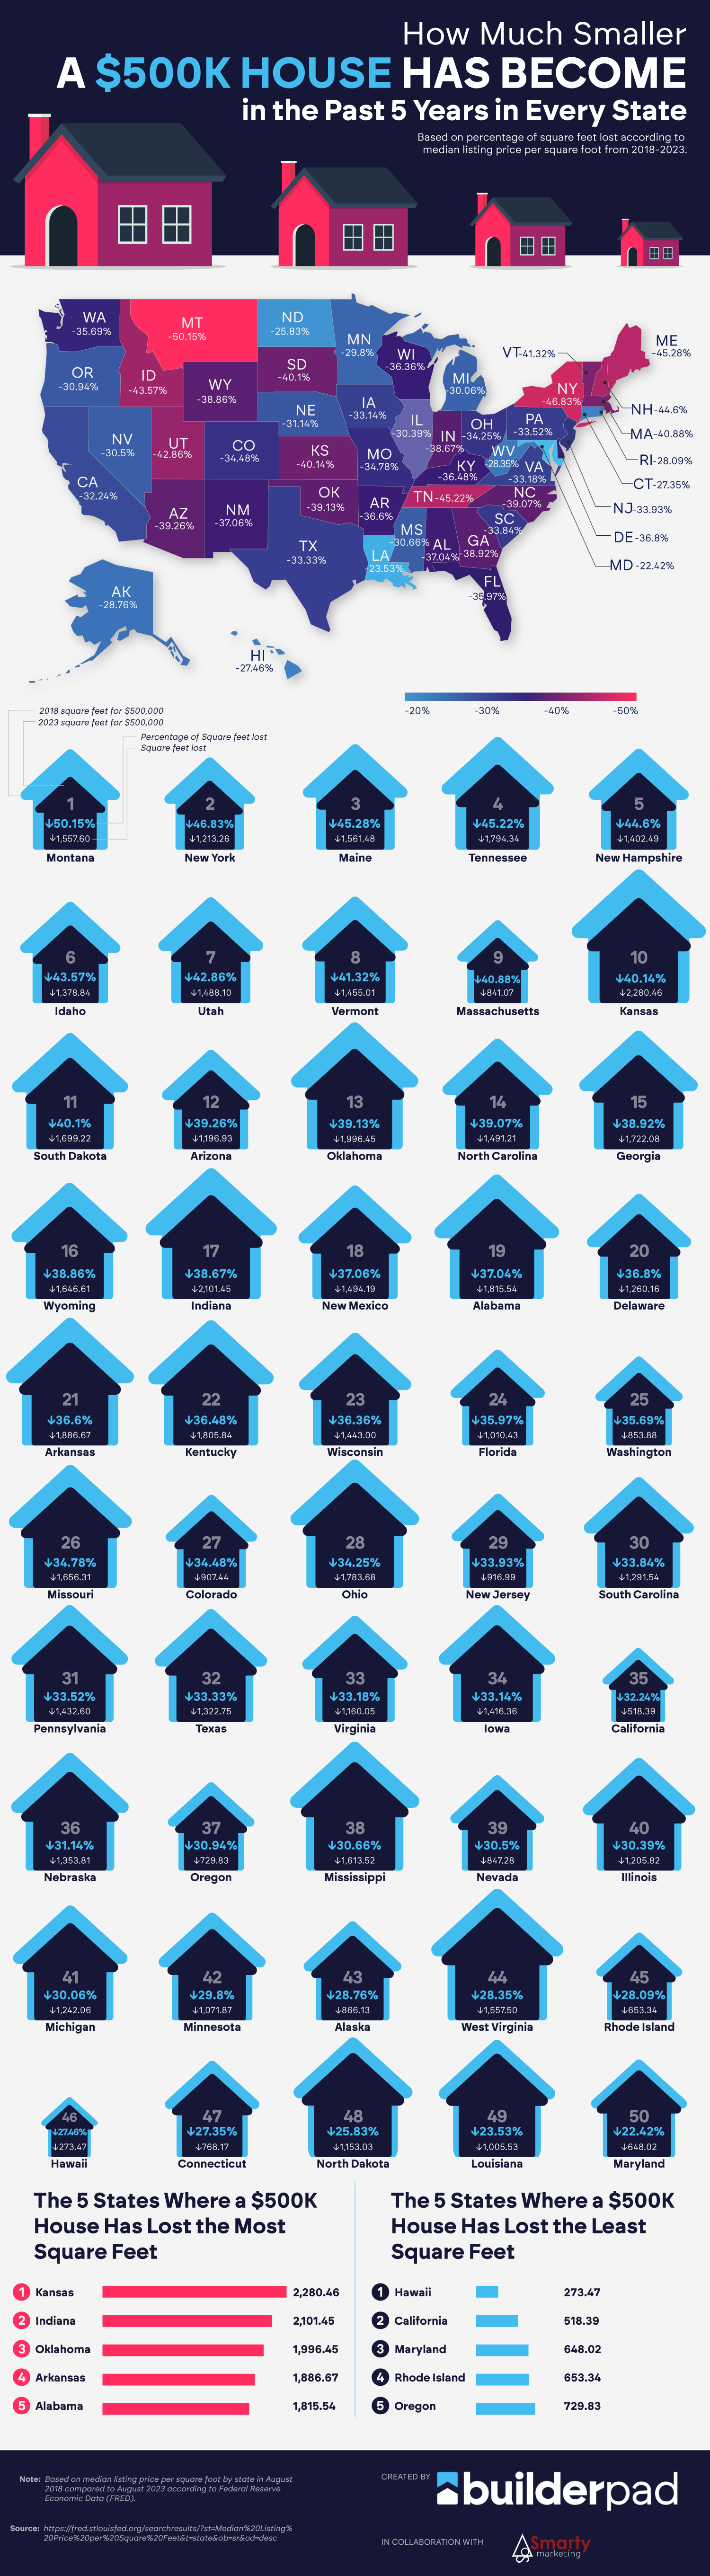
Obviously real estate prices differ city-by-city and even neighborhood-by-neighborhood, but this state-level analysis gives us a clear look at how this problem doesn’t necessarily have borders in the United States. Here’s a quick look at the 5 states that have lost the highest percentage of square feet in a $500K house between 2018 and 2023:
- Montana – 50.15%
- New York – 46.85%
- Maine – 45.28%
- Tennessee – 45.22%
- New Hampshire – 44.6%
And here are the 5 states that lost the most square feet in a $500K house between 2018 and 2023:
- Kansas – 2,280.46
- Indiana – 2,101.45
- Oklahoma – 1,996.45
- Arkansas – 1,886.67
- Alabama – 1,815.54
Leave a Reply