One of the best ways to dissect what’s happening in the world of business is with detailed data organized and explained in a simple, visual way. That’s exactly what the team at LLC Attorney did with this infographic. They collected all the Q3 data to rank businesses by market cap.
The market cap is determined by calculating share prices and the number of shares relative to the company’s size and value. Market cap represents outstanding shares of stock and it’s used for investment profiles and strategies. The team took things a step further and divided each company into its respective business sector. The result is a comprehensive look at the current state of the market that’s sure to help investors make decisions. If you’re a casual fan of stocks or a serious trader, this graphic is a lifesaver!
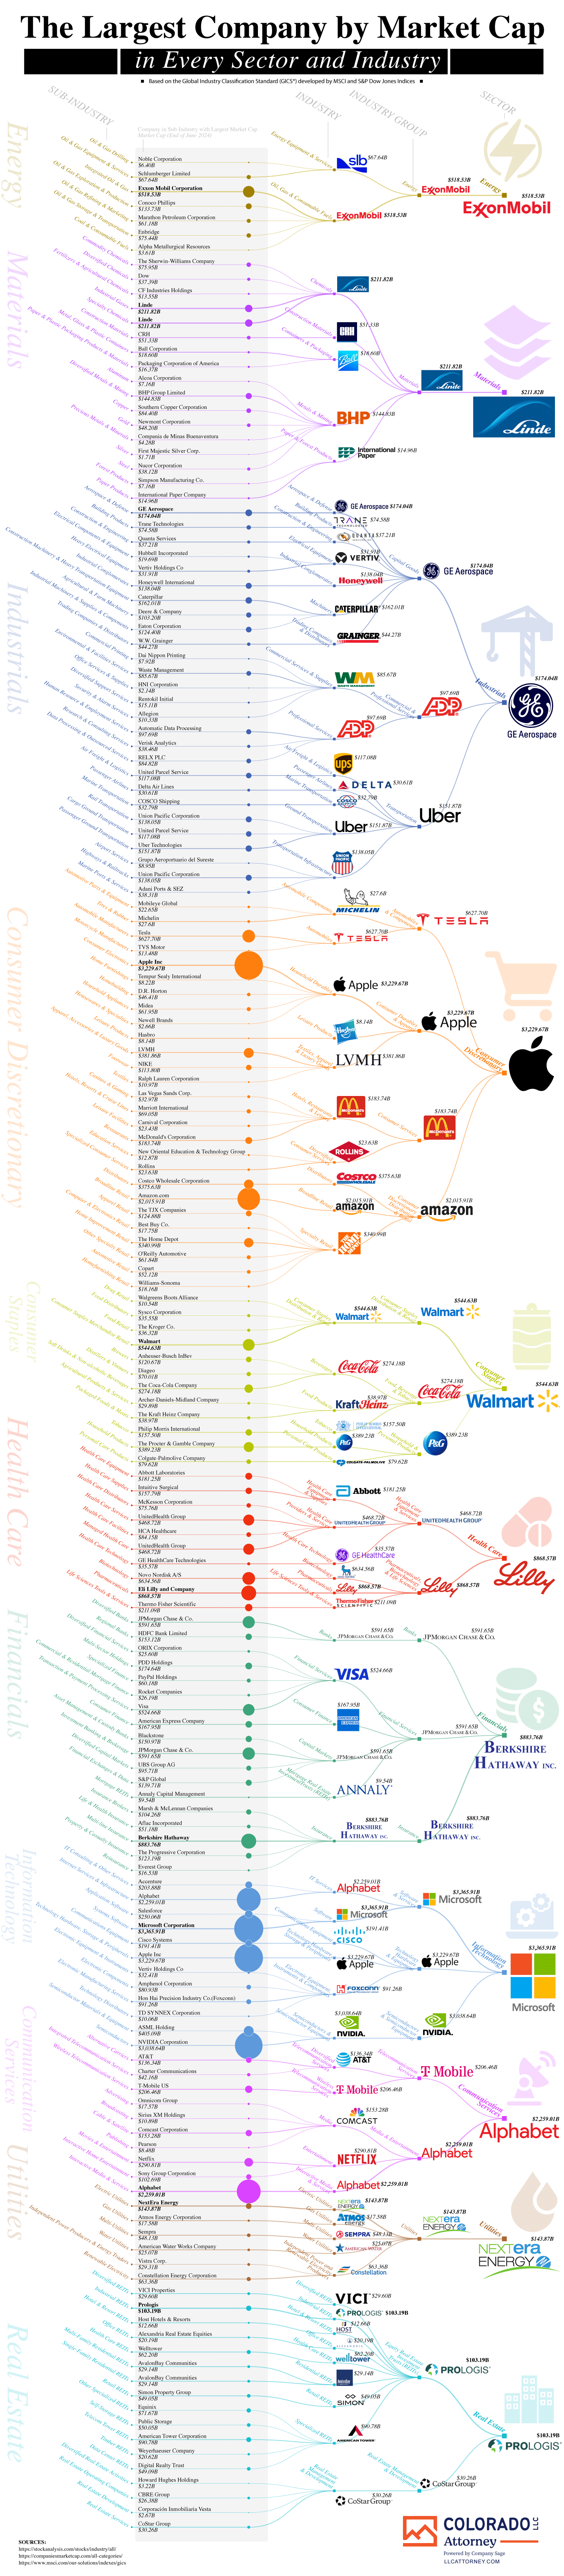
Currently, out of all the businesses across sectors, these are the top ten businesses:
- Microsoft ($3,365.91B)
- Apple ($3,229.67B)
- Nvidia ($3,038.64B)
- Alphabet Inc. (Google) ($2,259.01B)
- Amazon ($2,015.91B)
- Meta Platforms (Facebook) ($1,362B)
- Berkshire Hathaway ($883.76B)
- Eli Lilly ($868.57B)
- Broadcom ($812.17B)
- JPMorgan Chase ($595.32B)
It’s no surprise to see the tech industry at the top of the list. If you want more information on the many sub-industries represented in this graphic, the team broke that down as well in a highly detailed graph. Overall, if you want information on investment or you’re curious about the top businesses in each industry, this infographic is the perfect reference point.
Leave a Reply